|
如何用CSS显示进度条,方法很简单,我们可以利用CSS中“百分比”宽度的弹性准确地描绘出一个百分比柱形图。
1.首先在页面中建立一个DIV容器并添加名称为graph样式,其间添加一组strong标签作为文本对象的容器,注意其中除了调用名为bar的样式之外,还直接利用行内样式设置了strong的宽度为84%:
<div class="graph">
<strong class="bar" style="width: 84%;">jzxue.com 84%</strong>
</div>
2.在.graph中,我们要定义最终效果中的外围边框样式,border属性的3个参数分别定义了边框的粗细、线性以及颜色,在实际应用中要根据具体的页面风格进行修改。整个容器的宽度设置为200px,并利用padding设置DIV的内边距,目的是为了让边框与之后的文字背景色产生间距:
.graph {
position: relative; /* IE is dumb */
width: 200px;
border: 1px solid #B1D632;
padding: 2px;
}
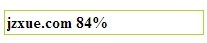
加入样式后的浏览效果如下:
3.样式.bar中,首先将strong标签内容转换为块级元素,配合背景颜色的设置进行作用。样式中除了设定文字的颜色、对齐方式及行高之外,最重要的是background属性,效果中的柱状条事实上就是这里设置的背景色,结合block显示方式最终得到良好的体现。
.graph .bar {
display: block;
position: relative;
background: #B1D632;
text-align: center;
color: #333;
height: 2em;
line-height: 2em;
}
最终效果如图:

我们可以运行下面的代码来查看最终的效果:
请把以下代码复制看看哦
<style>
.graph {
position: relative; /* IE is dumb */
width: 200px;
border: 1px solid #B1D632;
padding: 2px;
}
.graph .bar {
display: block;
position: relative;
background: #B1D632;
text-align: center;
color: #333;
height: 2em;
line-height: 2em;
}
</style>
<div class="graph">
<strong class="bar" style="width: 84%;">jzxue.com 84%</strong>
</div>
(责任编辑:admin) |